Understanding JMeter Listeners
Experienced QA Automation Engineer with 3.5 years in Ecommerce and Banking, skilled in automation/manual testing, test planning, execution, and end-to-end project delivery. Proficient in Agile, Scrum, performance testing, and SDET practices
Introduction
JMeter Listeners are essential components that provide valuable insights into performance test results. They offer real-time monitoring and analysis of various metrics such as response times, throughput, and error rates, enabling testers to assess the performance of web applications comprehensively.
What is Listeners ?
Listeners in JMeter serve as the eyes and ears of your test plan, capturing and presenting the results in various formats. Whether you need a graphical representation, tabular data, or assertion verification details, Listeners have you covered. Let's explore some commonly used Listeners and their functionalities.
Various Listeners in JMeter
Graph Results: Presents results in graphical form.
Spline Visualizer: Visualizes response times using a spline graph.
Assertion Results: Verifies results based on assertions.
Simple Data Writer: Writes results in CSV format.
Monitor Results: Monitors server performance.
Distribution Graph (alpha): Displays response time distribution.
Aggregate Graph: Saves execution results as a customizable bar graph.
Mailer Visualizer: Sends test results via email.
BeanShell Listener: Executes BeanShell scripts on test events.
Summary Report: Generates a summary of test results.
Sample Result Save Configuration: Configures saving of sample results.
Graph Full Results: Provides detailed graphical results.
View Results Tree: Displays details of sampler requests.
Aggregate Report: Generates a table-like report of results.
View Results in Table: Presents results in a tabular format.
Exploring Commonly Used Listeners
1. Aggregate Graph:
This listener saves execution results in the form of a customizable bar graph. Users can modify various settings for graph visualization and download the results in CSV or PNG formats.
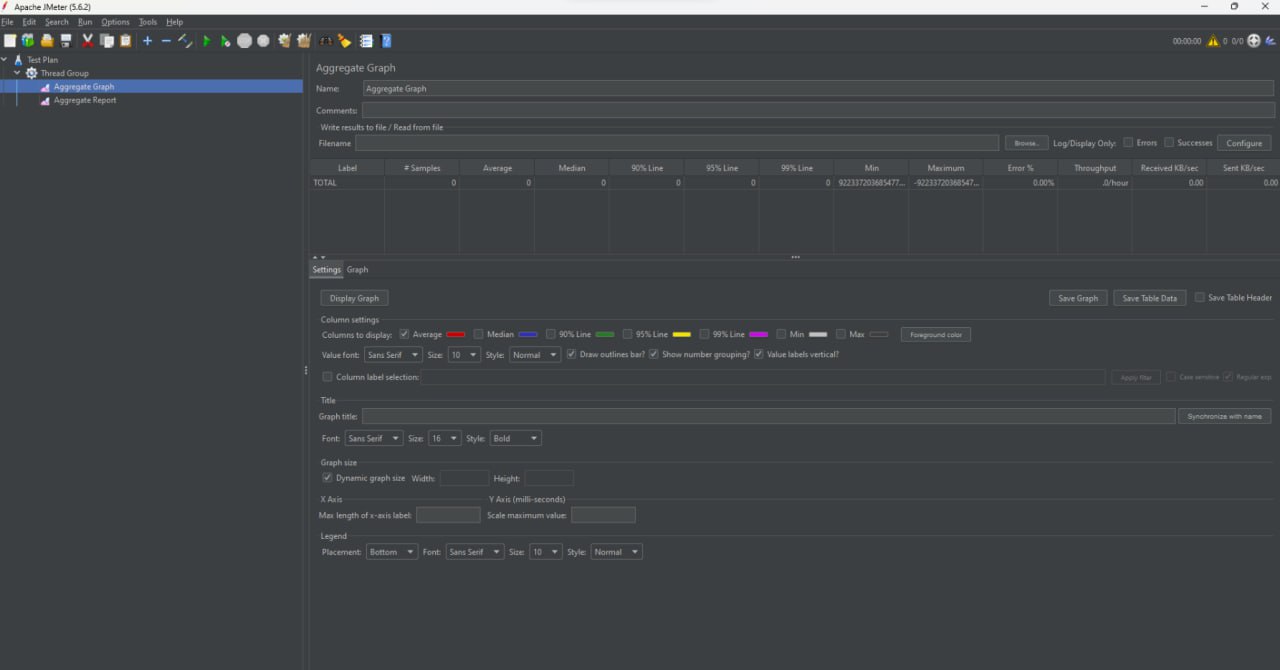
2. Aggregate Report:
The Aggregate Report listener in JMeter is a pivotal component that provides a consolidated view of essential performance metrics for each sampler in your test plan. It aggregates data such as response times, throughput, error rates, and more, offering a succinct summary of the overall performance of your application.
Key Components of the Aggregate Report
The Aggregate Report includes crucial metrics that provide insights into the efficiency and reliability of your application. Let's explore the key components:
Label: Represents the name of the sampler or transaction being analyzed.
Samples: Indicates the total number of samples/requests executed during the test.
Average: Represents the average response time of all samples.
Median: Reflects the median response time, providing a middle-ground value.
90% Line: Represents the response time below which 90% of the samples fall.
Min: Indicates the minimum response time recorded during the test.
Max: Represents the maximum response time observed.
Error %: Reflects the percentage of samples that resulted in errors.
Throughput: Represents the number of requests processed per unit of time.
Received KB/sec: Indicates the data transfer rate in kilobytes per second.
Sent KB/sec: Represents the rate of data sent in kilobytes per second.
Avg. Bytes: Reflects the average size of the sample response.
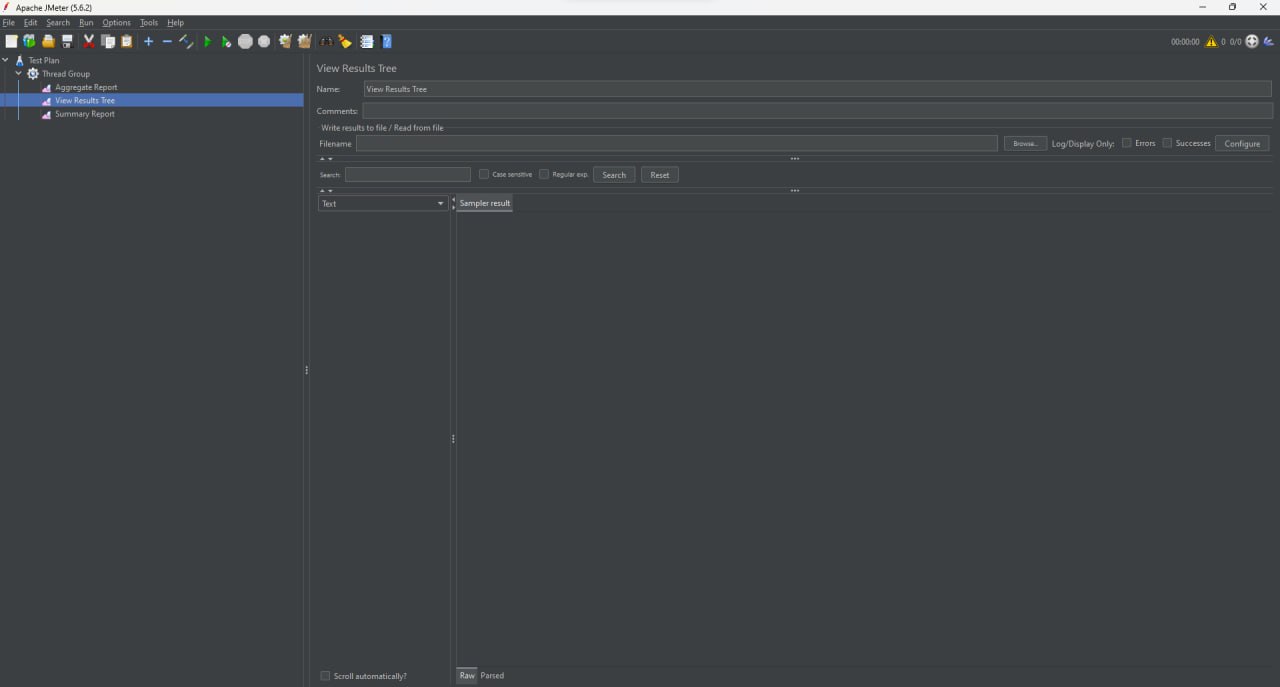
3. View Results Tree:
The View Results Tree listener in JMeter is an interactive and informative component that allows users to delve deep into the details of each sample or request executed during a test. It provides a comprehensive view of the response data, headers, and other essential information related to the sampler.
Key Features of the View Results Tree
Request Details: Displays detailed information about the executed sampler, including the request method, URL, and query parameters.
Response Data: Presents the raw response data received from the server, enabling users to inspect the content.
Response Headers: Shows the headers sent by the server in response to the request.
Response Time: Indicates the time taken for the server to respond to the request.
Sampler Result Status: Provides the result status of the sampler, indicating success or failure.
Assertion Results: If assertions are configured in the test plan, the View Results Tree displays their results, highlighting any failures.
Request and Response Size: Shows the size of the request and response in bytes.
Response Code: Represents the HTTP response code returned by the server.

Conclusion
In conclusion, JMeter Listeners are indispensable tools for performance testers, offering deep visibility into test execution and results. By leveraging the capabilities of Listeners, testers can gather crucial performance data, identify issues, and fine-tune their test scenarios to optimize application performance effectively.