Crafting Your JMeter Test Plan: A Practical Guide
Experienced QA Automation Engineer with 3.5 years in Ecommerce and Banking, skilled in automation/manual testing, test planning, execution, and end-to-end project delivery. Proficient in Agile, Scrum, performance testing, and SDET practices
Introduction
A JMeter Test Plan serves as the blueprint for performance testing in JMeter, outlining the steps and scenarios to be simulated. It includes elements such as thread groups, controllers, listeners, and assertions, all orchestrated to evaluate the performance of web applications under various conditions.
A test plan can be visualized as your JMeter script for running tests. This blog will guide you through the process of building a JMeter test plan, covering essential steps to create, configure, and execute your tests.
Step 1: Launch the JMeter Window
Go to your JMeter bin folder and double click on the ApacheJMeter.jar file to launch the JMeter interface.
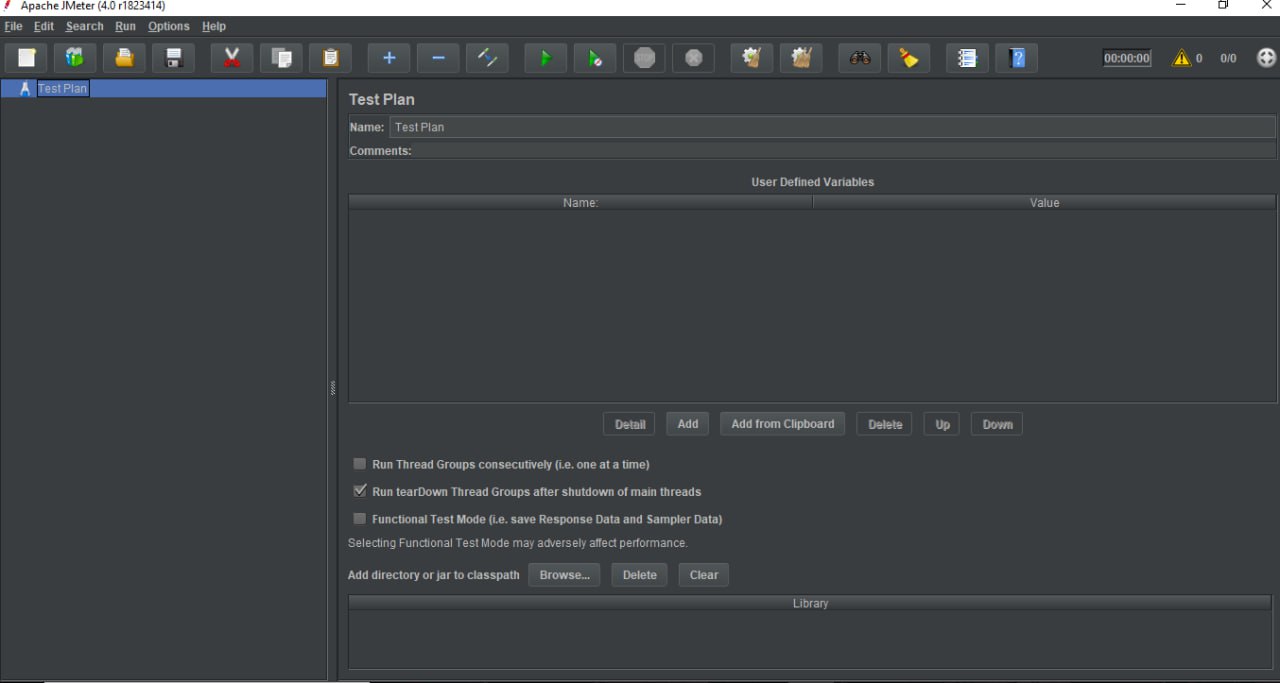
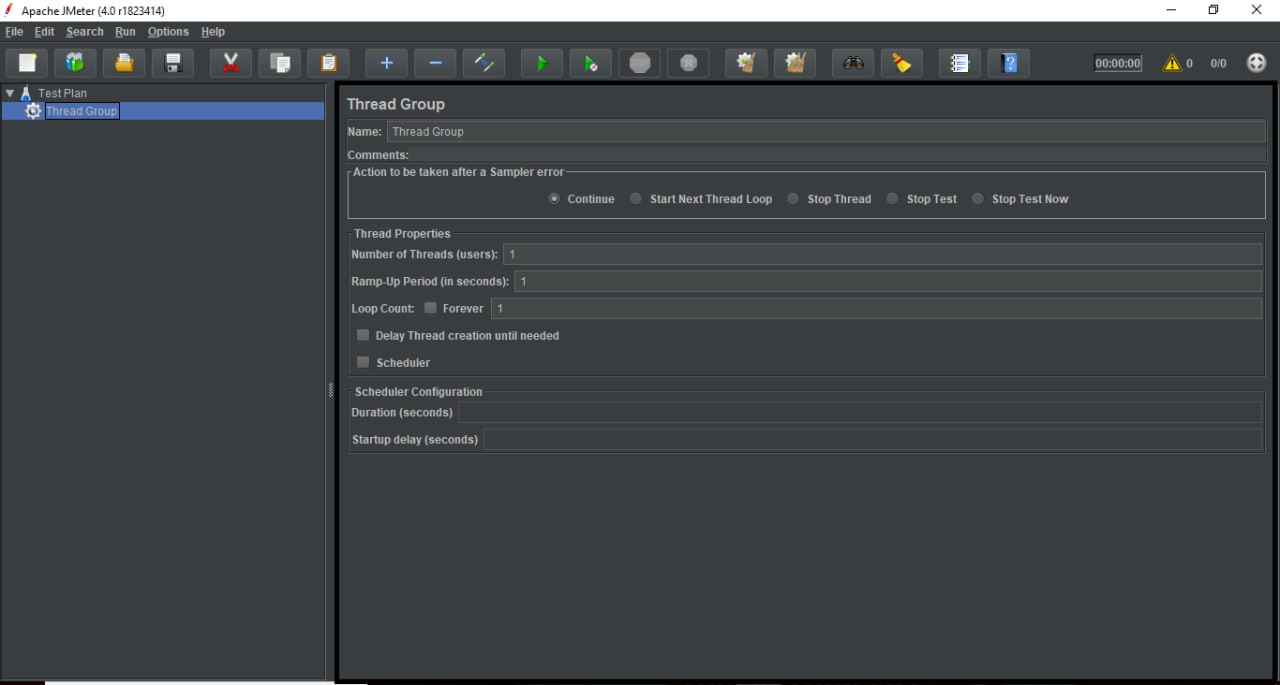
The following image shows the default JMeter interface without any additional elements added to it:
The default JMeter interface contains a Test Plan node where the real test plan is kept. The Test Plan node includes the name of the test plan and user-defined variables, offering flexibility when values need repetition in different parts of the plan.
Step 2: Add/Remove Test Plan Elements
Add Element:
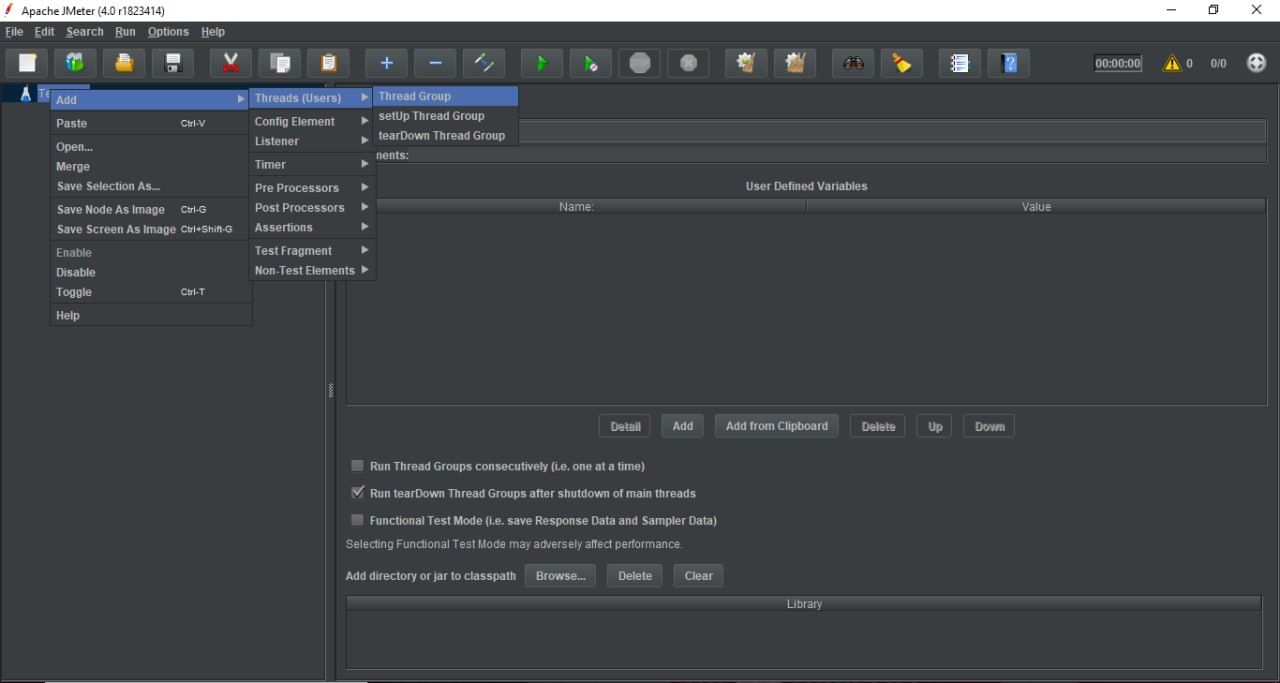
Right-click on the Test Plan node.
Hover over the "Add" option, and a list of elements will be displayed.
Select the desired element by clicking on it.
The following image shows how to add a thread group element in a test plan:
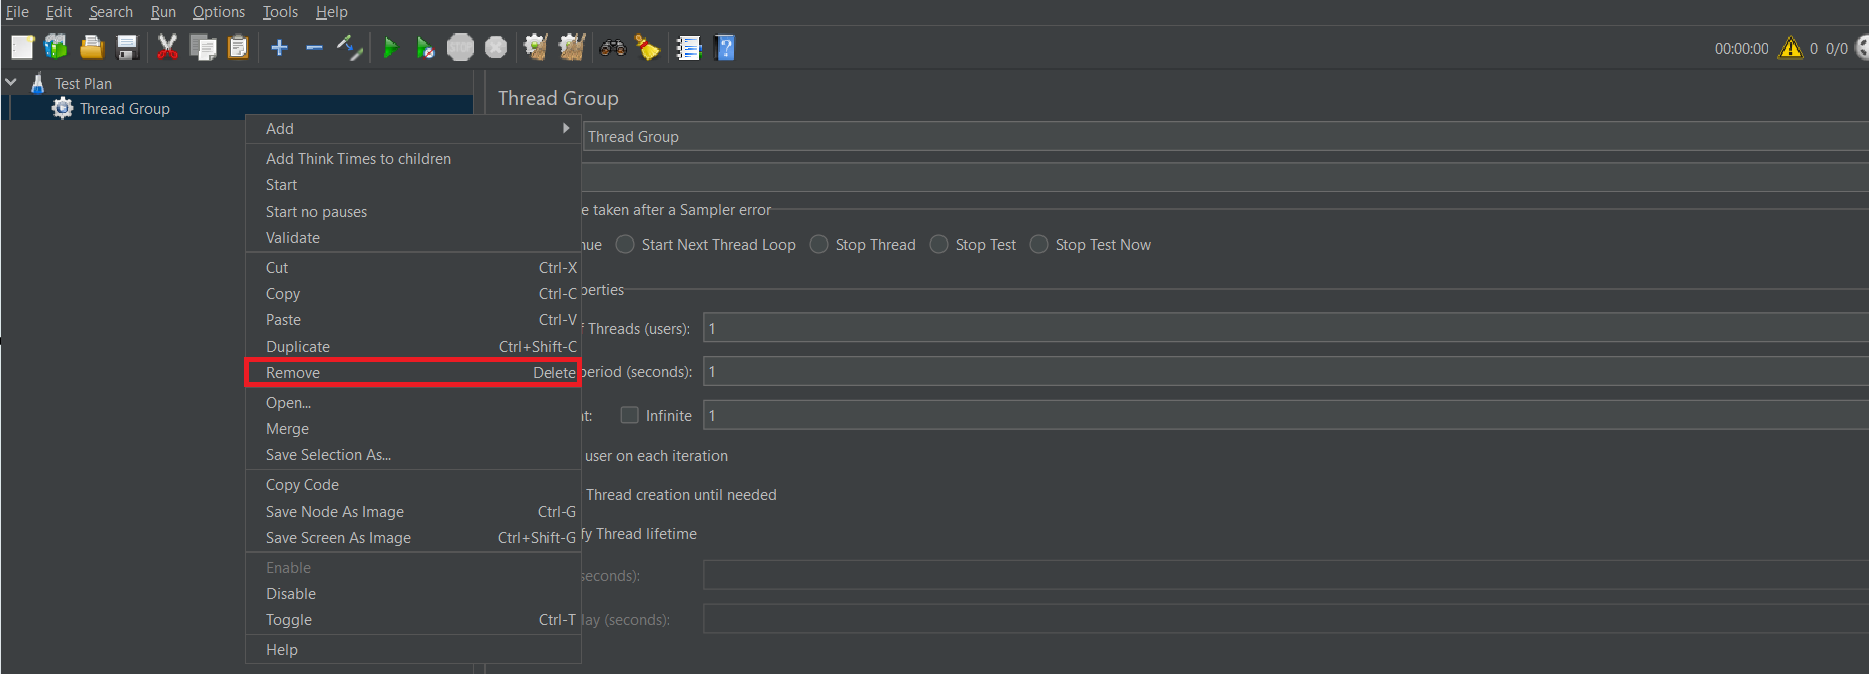
Remove Element:
Select the desired element.
Right-click on the element and choose the "Remove" option.
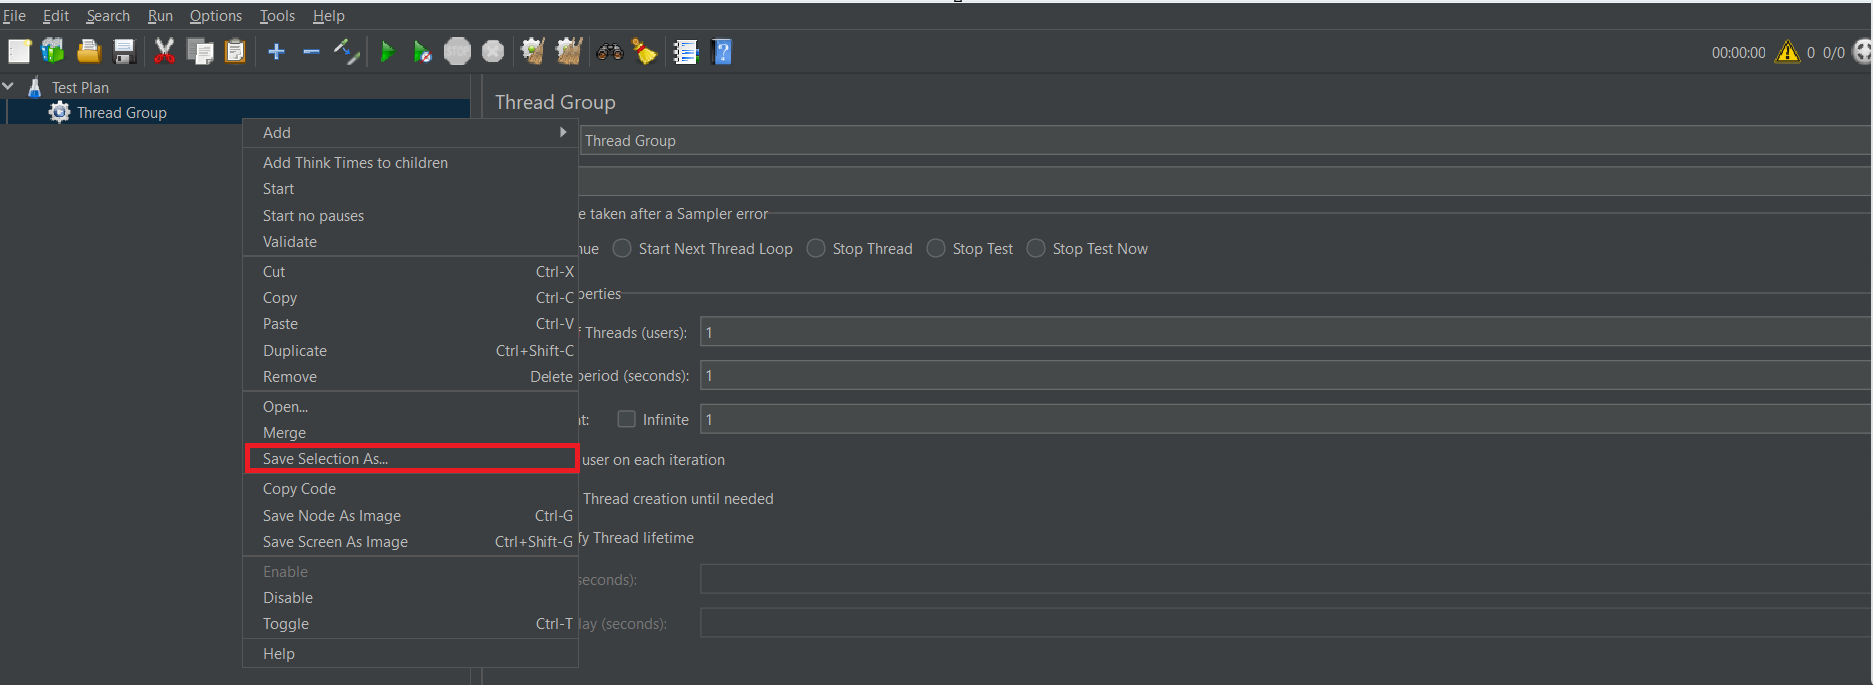
Step 3: Save Test Plan Elements
Right-click on the element.
Choose the "Save Selection As" option and save the file in the desired location.
Step 4: Configure Tree Elements
Elements in the test plan can be configured using controls present on JMeter's right-hand side frame. These controls allow you to configure the behavior of the selected element. For example, a thread group can be configured by specifying its name, the number of threads, ramp-up time, and loop count.
Step 5: Save JMeter Test Plan
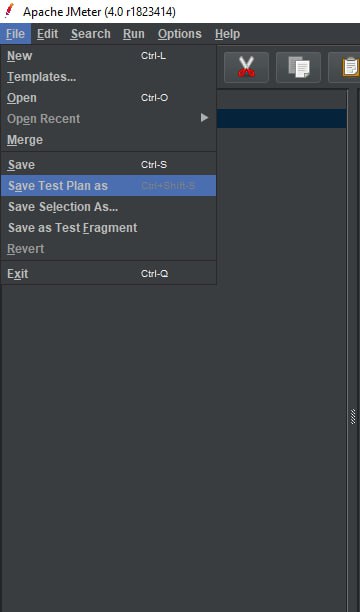
Once you have created a test plan, added elements, and configured the tree, save the entire test plan by choosing "Save" or "Save Test Plan As" from the file menu.
Step 6: Run JMeter Test Plan
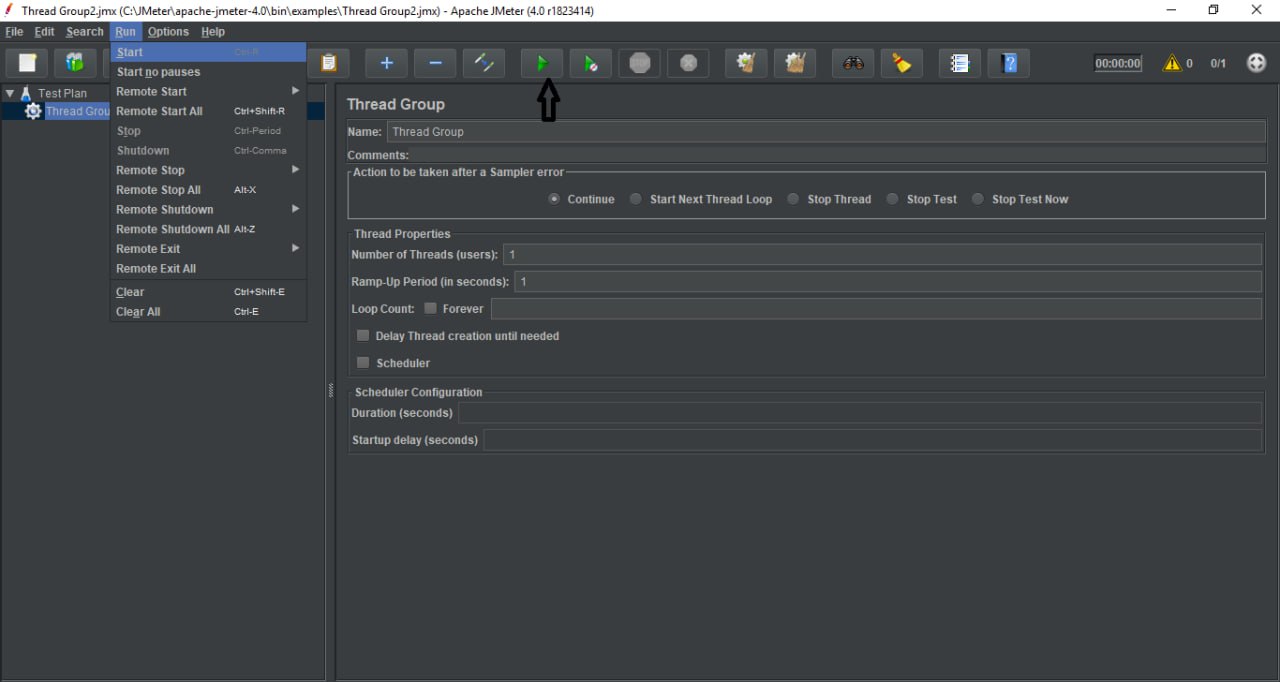
You can run the test plan by clicking on the Start (Control + r) from the Run menu item or you can simply click the green play button.
When the test plan starts running, the JMeter interface shows a green circle at the right-hand end of the section just under the menubar. The numbers to the left of the green circle represent the number of active threads out of the total number of threads.
Step 7: Stop JMeter Test Plan
You can stop the test plan by using Stop (Control + '.') - It stops the threads immediately if possible.
You can also use Shutdown (Control + ',') - It requests the threads to stop at the end of any on-going task.
Step 8: Check JMeter Test Plan Execution Logs
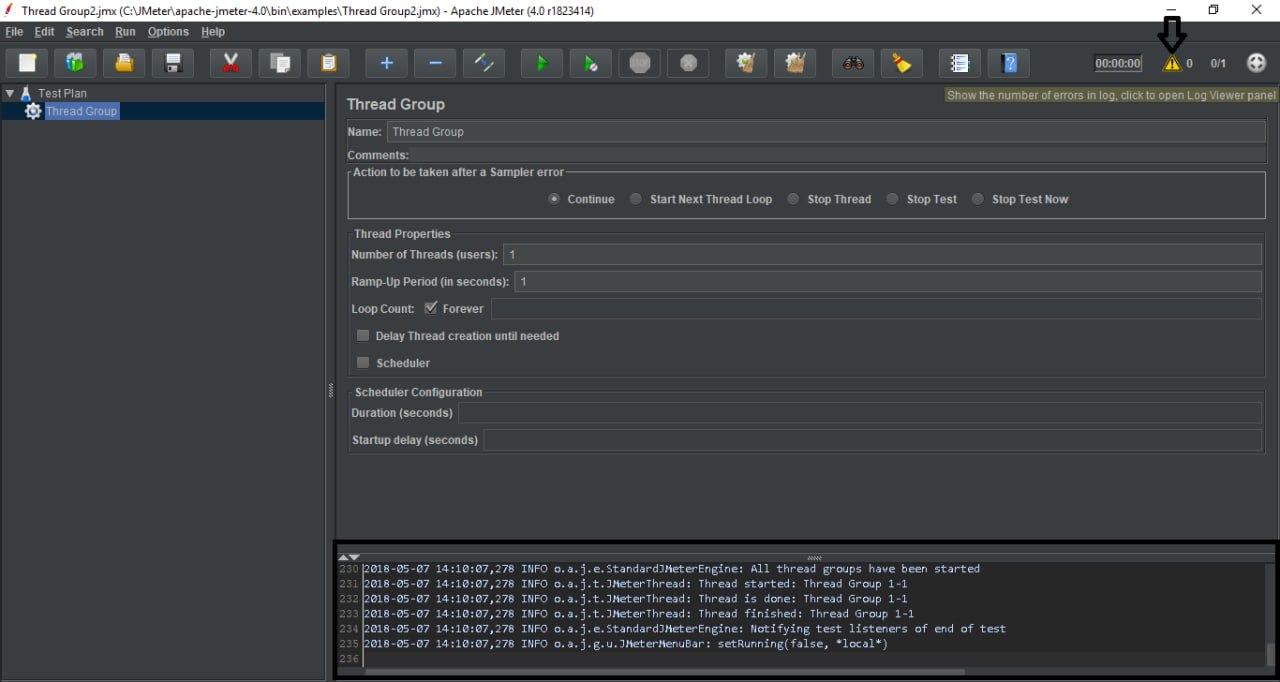
JMeter stores the test run details, warnings, and errors to the jmeter.log file. Access JMeter logs by clicking on the exclamation sign present at the right-hand side of the section just under the menubar.
Conclusion
In conclusion, the JMeter Test Plan is the backbone of performance testing, providing a structured approach to simulate user behavior and analyze application performance. By meticulously designing and executing test plans, testers can uncover performance bottlenecks, optimize application performance, and ensure the delivery of reliable and high-performing web applications.